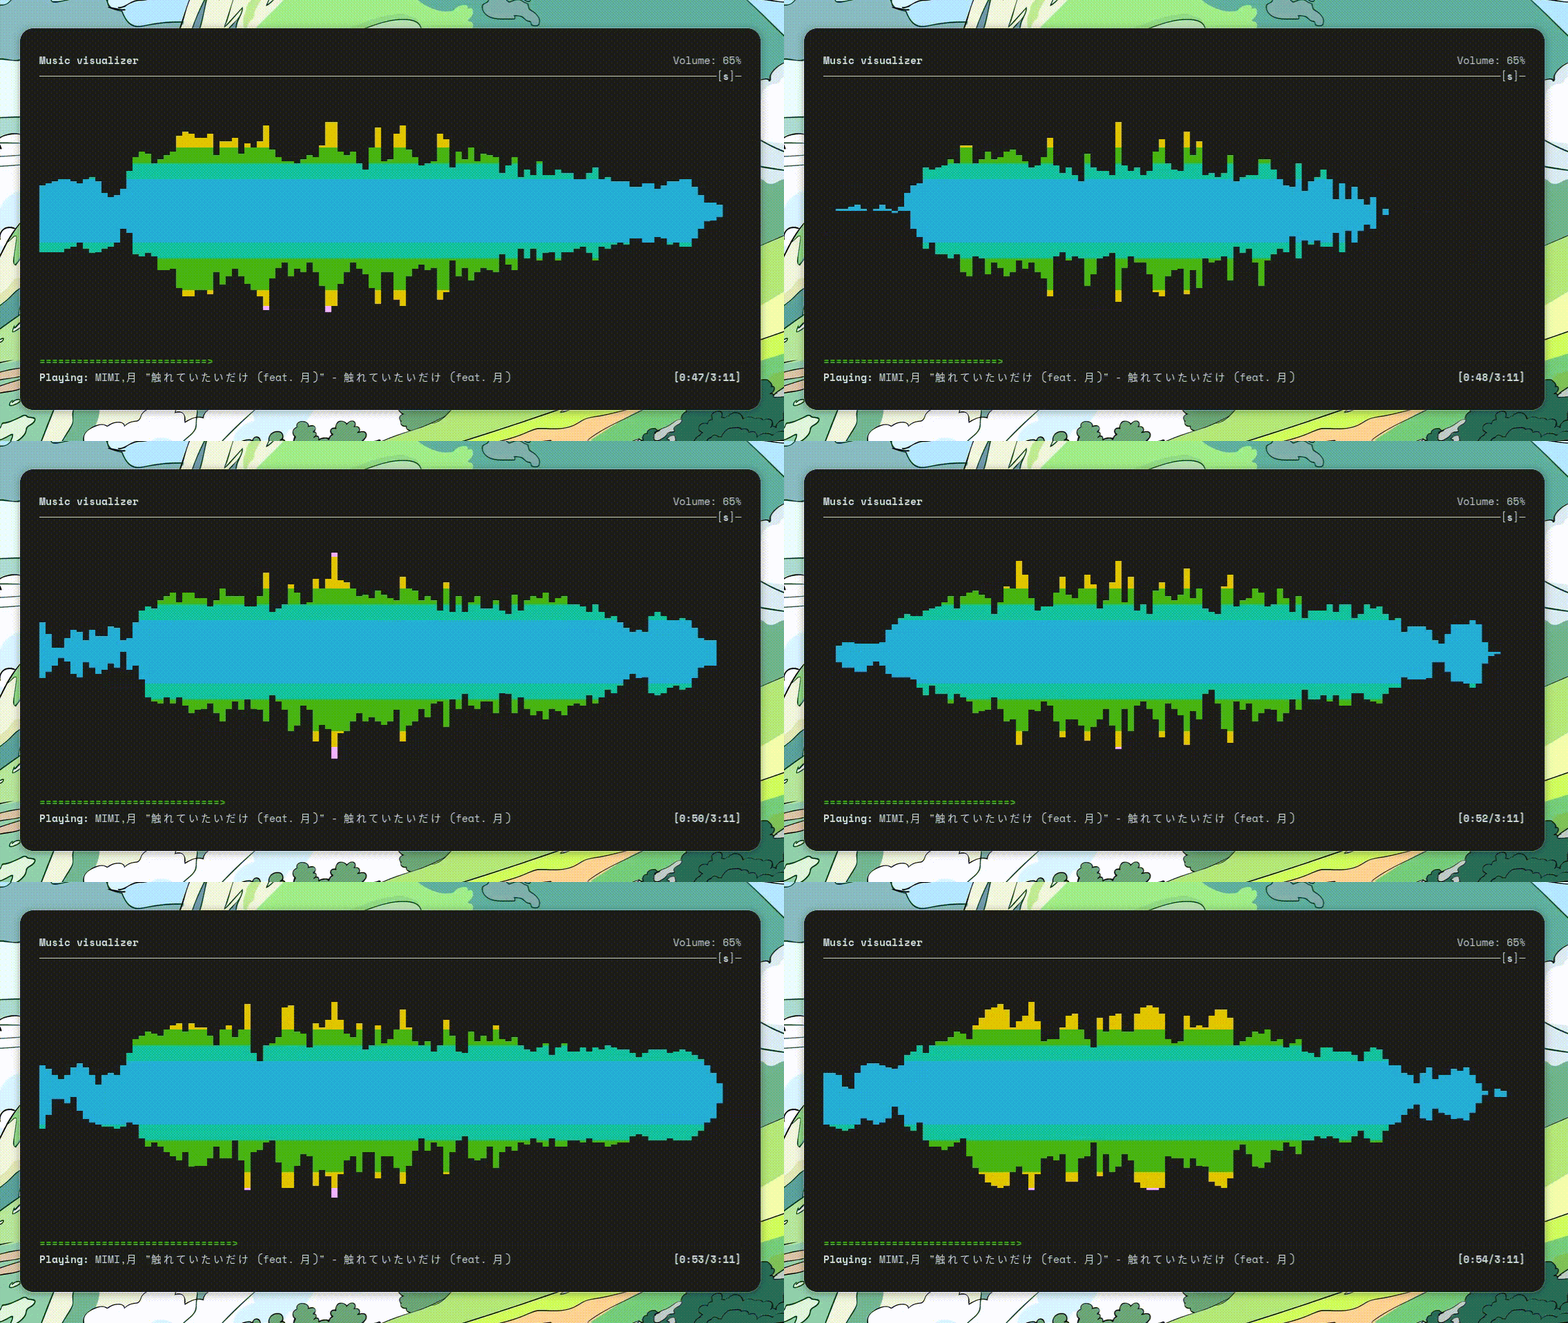
最近换上了 ArchLinux,体验了众多美观的 TUI 应用。其中我认为最酷炫的当属 ncmpcpp 这个音乐播放器了。
日常办公时把它放在屏幕角落,就会感觉工作环境变得更有趣了。这也让我对它的实现产生了巨大的好奇心,于是我决定探索一下它是如何实现的。
本文将深入底层,从音频编码开始讲起,探究 wav 格式的音频文件是如何被解析的,然后再讲解如何通过傅立叶变换将音频信号转换为频谱图,最后再着手实现。
中学物理教过我们,声音是一种机械波,由物体振动产生,通过介质传播。当波通过介质传递到耳朵时,耳膜会随之振动,我们才能听到声音。
声波会引起麦克风(注:这里以动圈式麦克风为例)传感器中的振膜振动,振膜与被磁铁包围着住的线圈相连,根据法拉第定律和楞次定律,振膜振动会使磁场中线圈移动而产生感应电流。此时,只需要监测线圈两极的电压即可得到声音的波形图。机械振动就被转换为了电压信号。
我们现在得到的是连续的模拟信号,还需要将其转换成计算机可识别的离散的数字信号。
这时候,我们需要对信号进行模数转换(ADC)。AD 芯片每隔一段时间(几微秒)对波形图打点采样,得到每一个点的电压值,然后量化为二进制数,最后再进行编码,我们就得到了音频波形数据。
和图像、视频一样,音频编码格式也主要分为两大类:有损压缩和无损压缩格式。
wav 就是一种典型的无损压缩格式,它是由微软和 IBM 共同开发的一种音频文件格式。它被称为“波形文件”,它也是相对好理解的一个音频格式。
一个完整的 wav 文件必须包含两个区块:Format Chunk 和 Data Chunk
下面是一个包含了以上两个 Chunk 的 WAV 文件的例子:
1
2
3
4
5
6
7
8
9
10
11
12
13
__________________________ | RIFF WAVE Chunk | | groupID = 'RIFF' | | riffType = 'WAVE' | | __________________ | | | Format Chunk | | | | ckID = 'fmt ' | | | |__________________| | | __________________ | | | Sound Data Chunk | | | | ckID = 'data' | | | |__________________| | |__________________________|
Format Chunk 包含了重要的描述波形的参数:
采样率(Sample Rate):每秒采样模拟信号的次数
采样宽度(Sample Width):每个采样点的位数
声道数量(Audio Channels)
采样帧总数(Sample Frame)
压缩方式(Compression Type)
Data Chunk 包含了实际的波形数据,这些数据由一连串的采样帧组成,按时间顺序排列。
一个采样点表示一次采样内声音的振幅值。采样点位数越高,可表示的值的范围就越大,音频的质量就越好,但是文件的大小也就越大。一个采样帧包含了一次采样的所有声道的采样点。比如,我有左右两个声道,每个声道有 16 位的采样点,那么一个采样帧就包含了 32 位的数据。
在 Python 中,我们可以使用 wave 模块来读取 wav 文件:
440hz_16bit_5s.wav:
1
2
3
4
5
import wavewith wave.open ('440hz_16bit_5s.wav' , 'rb' ) as f: print (f.getparams()) print (f.readframes(20 ))
输出如下内容:
1
2
_wave_params(nchannels=1, sampwidth=2, framerate=44100, nframes=220500, comptype='NONE', compname='not compressed') b'\x00\x00\x8d\x05\x13\x0b\x8e\x10\xf9\x15M\x1b\x87 \xa0%\x93*Z/\xf33W8\x82<p@\x1eD\x88G\xa9J\x7fM\x07P?R'
这段音频有一个声道,每个采样点占 2 byte,采样率为 44100,总共有 220500 个采样帧。220500 / 44100 = 5 秒。
后面读出的采样帧字符串是一段十六进制转义序列,我们可以使用 struct 模块来解析:
1
2
3
4
5
6
7
8
9
10
11
import waveimport structdef read_wave (filename ): with wave.open (filename, 'rb' ) as f: nframes = f.getnframes() frames = f.readframes(nframes) return struct.unpack(f'<{nframes} h' , frames) data = read_wave('440hz_16bit_5s.wav' ) print (data[:10 ])
在这里我们解析了前 10 个采样帧,h 表示短整型,< 表示小端序。WAVE 文件采用小端序来存储数据。
输出如下:
1 (0, 1421, 2835, 4238, 5625, 6989, 8327, 9632, 10899, 12122)
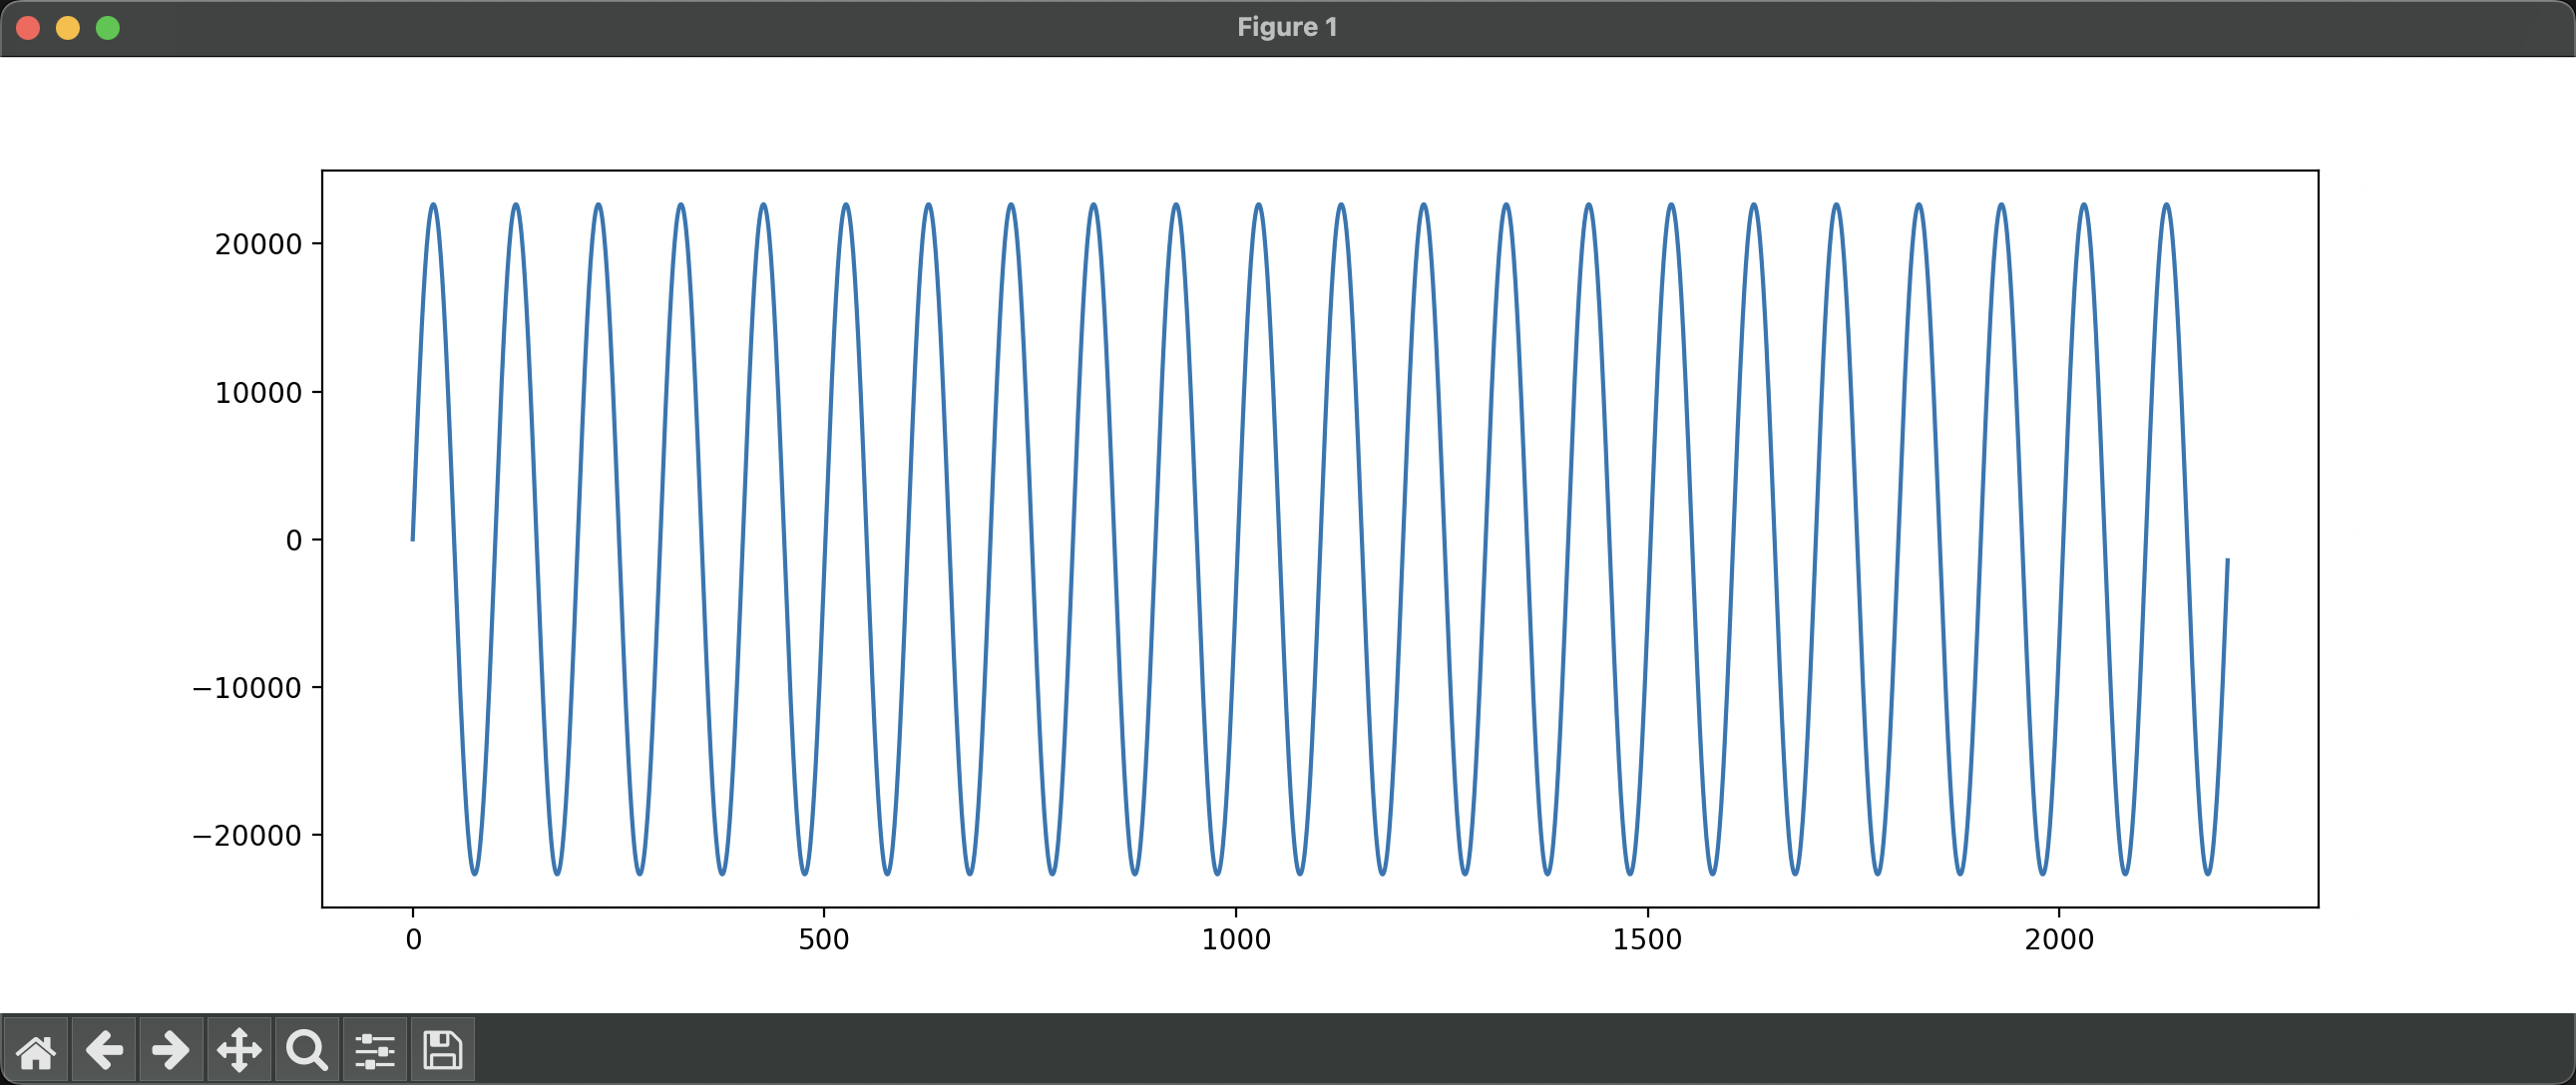
我们发现这一段数字是逐渐增加的,很符合波形的特点。截取前 0.05 秒的波形,然后根据时间绘制波形图:
可以发现这是一个正弦波。横轴为时间,纵轴为振幅。由于这段音频的采样宽度为 16 位,所以振幅的范围是 [ − 2 15 , 2 15 − 1 ] [-2^{15}, 2^{15}-1] [ − 2 1 5 , 2 1 5 − 1 ] [ − 32768 , 32767 ] [-32768, 32767] [ − 3 2 7 6 8 , 3 2 7 6 7 ]
到目前为止,我们已经成功地将音频文件解析为了波形数据,并且成功可视化出了声波振幅随时间变化的波形图。不过,我们想象中的 440Hz 的“可视化图像”应该是那种“只有一个峰”的频谱图,和一开始提到的 ncmpcpp 的效果是一样的。那如何将这种数据转化成频谱图呢?这里,我们需要用到傅立叶变换。
傅立叶变换是一种将信号从时域转换到频域的方法,它可以将一个信号分解为一系列不同频率的正弦波。快速傅立叶变换(FFT)是一种计算傅立叶变换的高效算法。下面是快速傅立叶变换的 Python 实现:
1
2
3
4
5
6
7
8
9
def fft (x ): N = len (x) if N <= 1 : return x even = fft(x[0 ::2 ]) odd = fft(x[1 ::2 ]) T = [cmath.exp(-2j * math.pi * k / N) * odd[k] for k in range (N // 2 )] return [even[k] + T[k] for k in range (N // 2 )] + \ [even[k] - T[k] for k in range (N // 2 )]
它的输入是一系列采样点的振幅值,输出是一系列复数,表示不同频率的正弦波的振幅和相位。让我们把上面的 440Hz 的波形数据输入到这个函数中:
1
2
3
4
5
6
7
8
[ (503643 +0j ), (-68801.16613674666 +116234.4683635989j ), (-23890.51738479154 +53037.36938852984j ), (-16335.061327176663 +34280.395464007364j ), (-13741.719659027507 +24979.846914594244j ), ... ]
我们将原始波形数据应用于 FFT,然后将得到的复数值转换为其模长,并进行归一化:
1
2
3
4
5
6
7
def scale_spectrum (spectrum_complex, max_value: int = 10 ): '''将频谱复数转换为振幅,并归一化''' spectrum = [abs (freq) for freq in spectrum_complex] max_spectrum = max (max (spectrum), 1 ) return [int (max_value * freq / max_spectrum) for freq in spectrum] spectrum = scale_spectrum(fft(data[:512 ]))[:20 ]
输出:
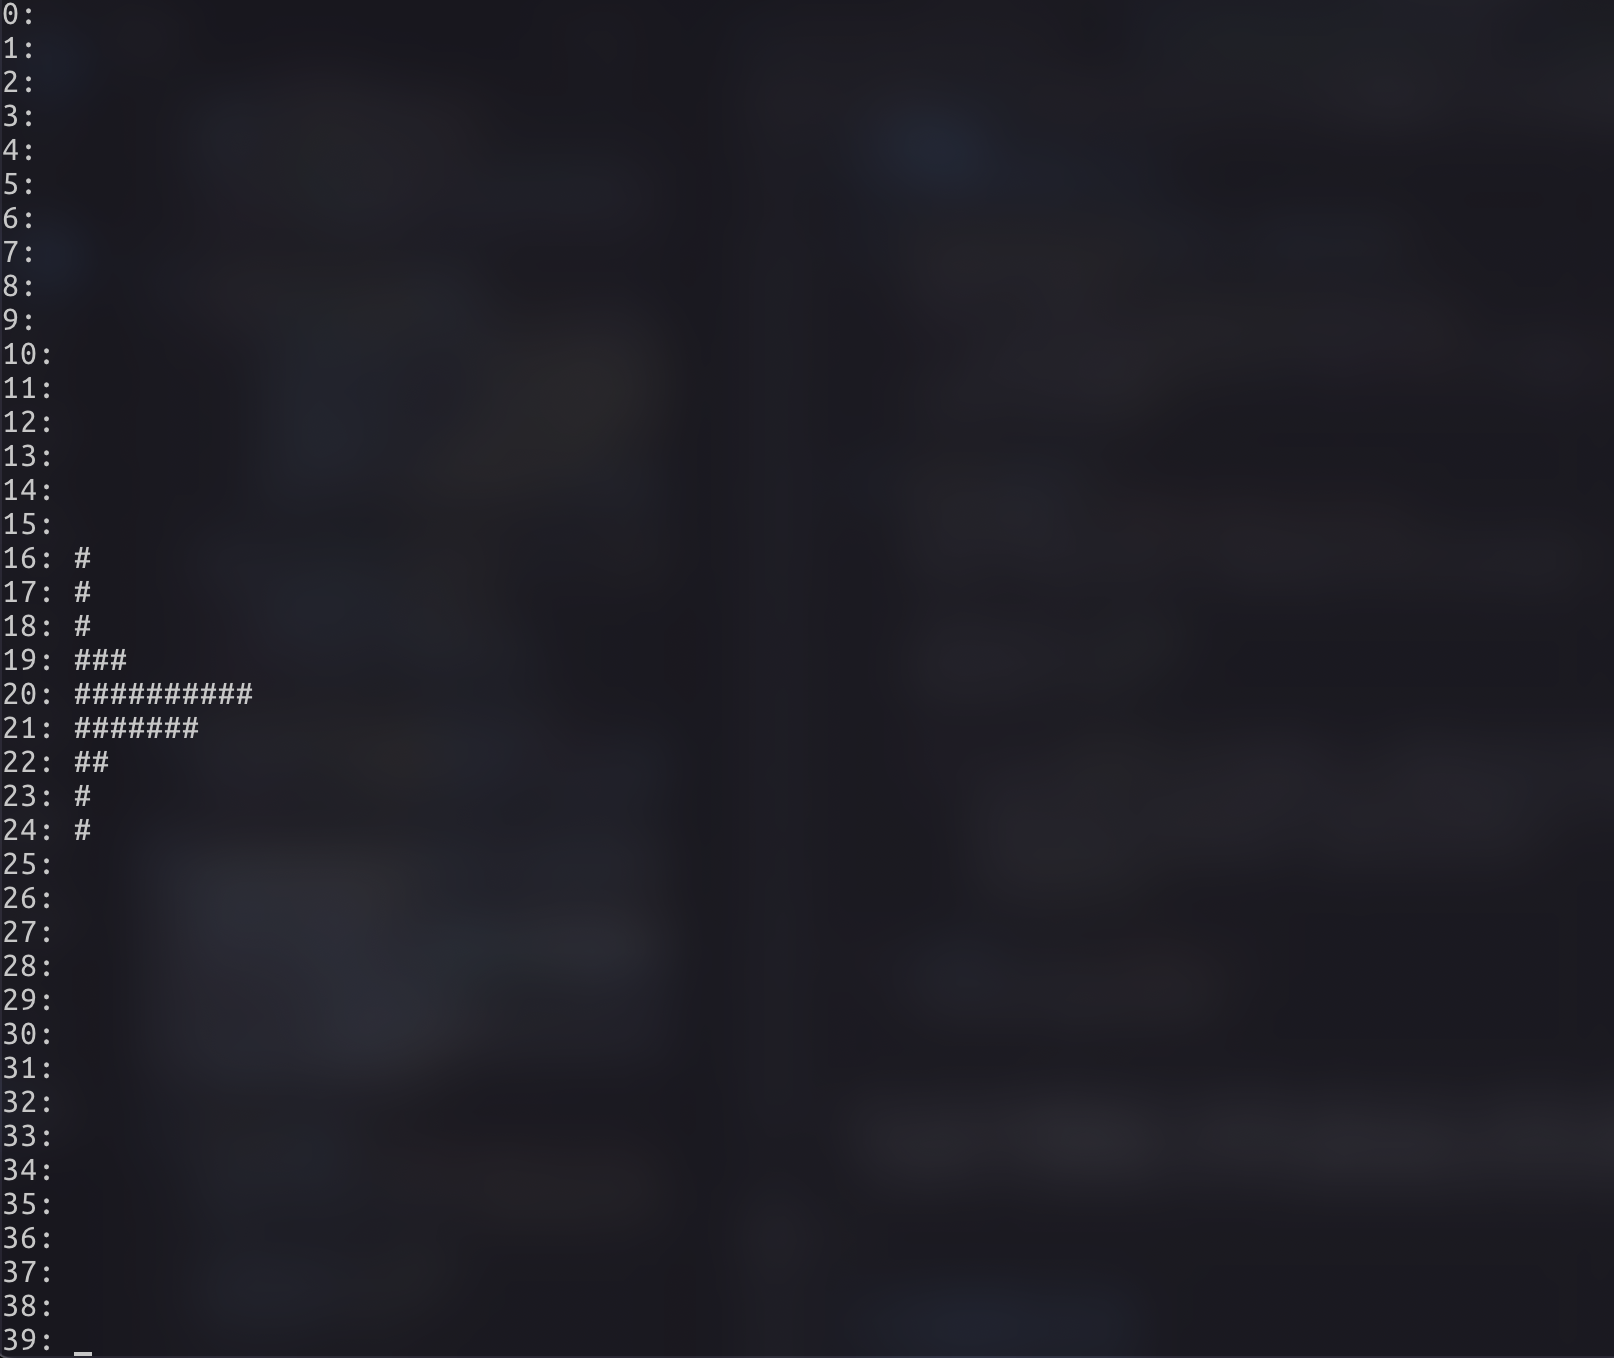
1 [0, 0, 0, 0, 0, 9, 1, 0, 0, 0, 0, 0, 0, 0, 0, 0, 0, 0, 0, 0]
是不是有感觉了?!我们采用了前 512 个采样帧的频谱数据,并将它们缩放到 0-10 的范围内,然后取前 20 个频率的振幅值。我们可以使用 curses 模块来绘制频谱图:
1
2
3
4
5
6
7
8
9
10
11
12
13
14
15
16
17
18
19
20
21
22
23
import curses, timedef draw_spectrum (stdscr, spectrum ): stdscr.clear() for i, freq in enumerate (spectrum): stdscr.addstr(i, 0 , f'{i} : {"#" * freq} ' ) stdscr.refresh() def main (stdscr ): file_name = '440hz_16bit_5s.wav' data, frame_rate = read_wav_file(file_name) frame_size = 2048 hop_size = 512 for i in range (0 , len (data) - frame_size, hop_size): spectrum = scale_spectrum(fft(data[i:i + frame_size])) draw_spectrum(stdscr, spectrum[:40 ]) time.sleep(0.05 ) if __name__ == "__main__" : curses.wrapper(main)
这里,我们对音频数据进行了分帧处理,每帧 2048 个采样帧,帧移 512 个采样帧。然后我们计算每一帧的频谱,并绘制频谱图。我们可以看到频谱图随时间变化的效果。
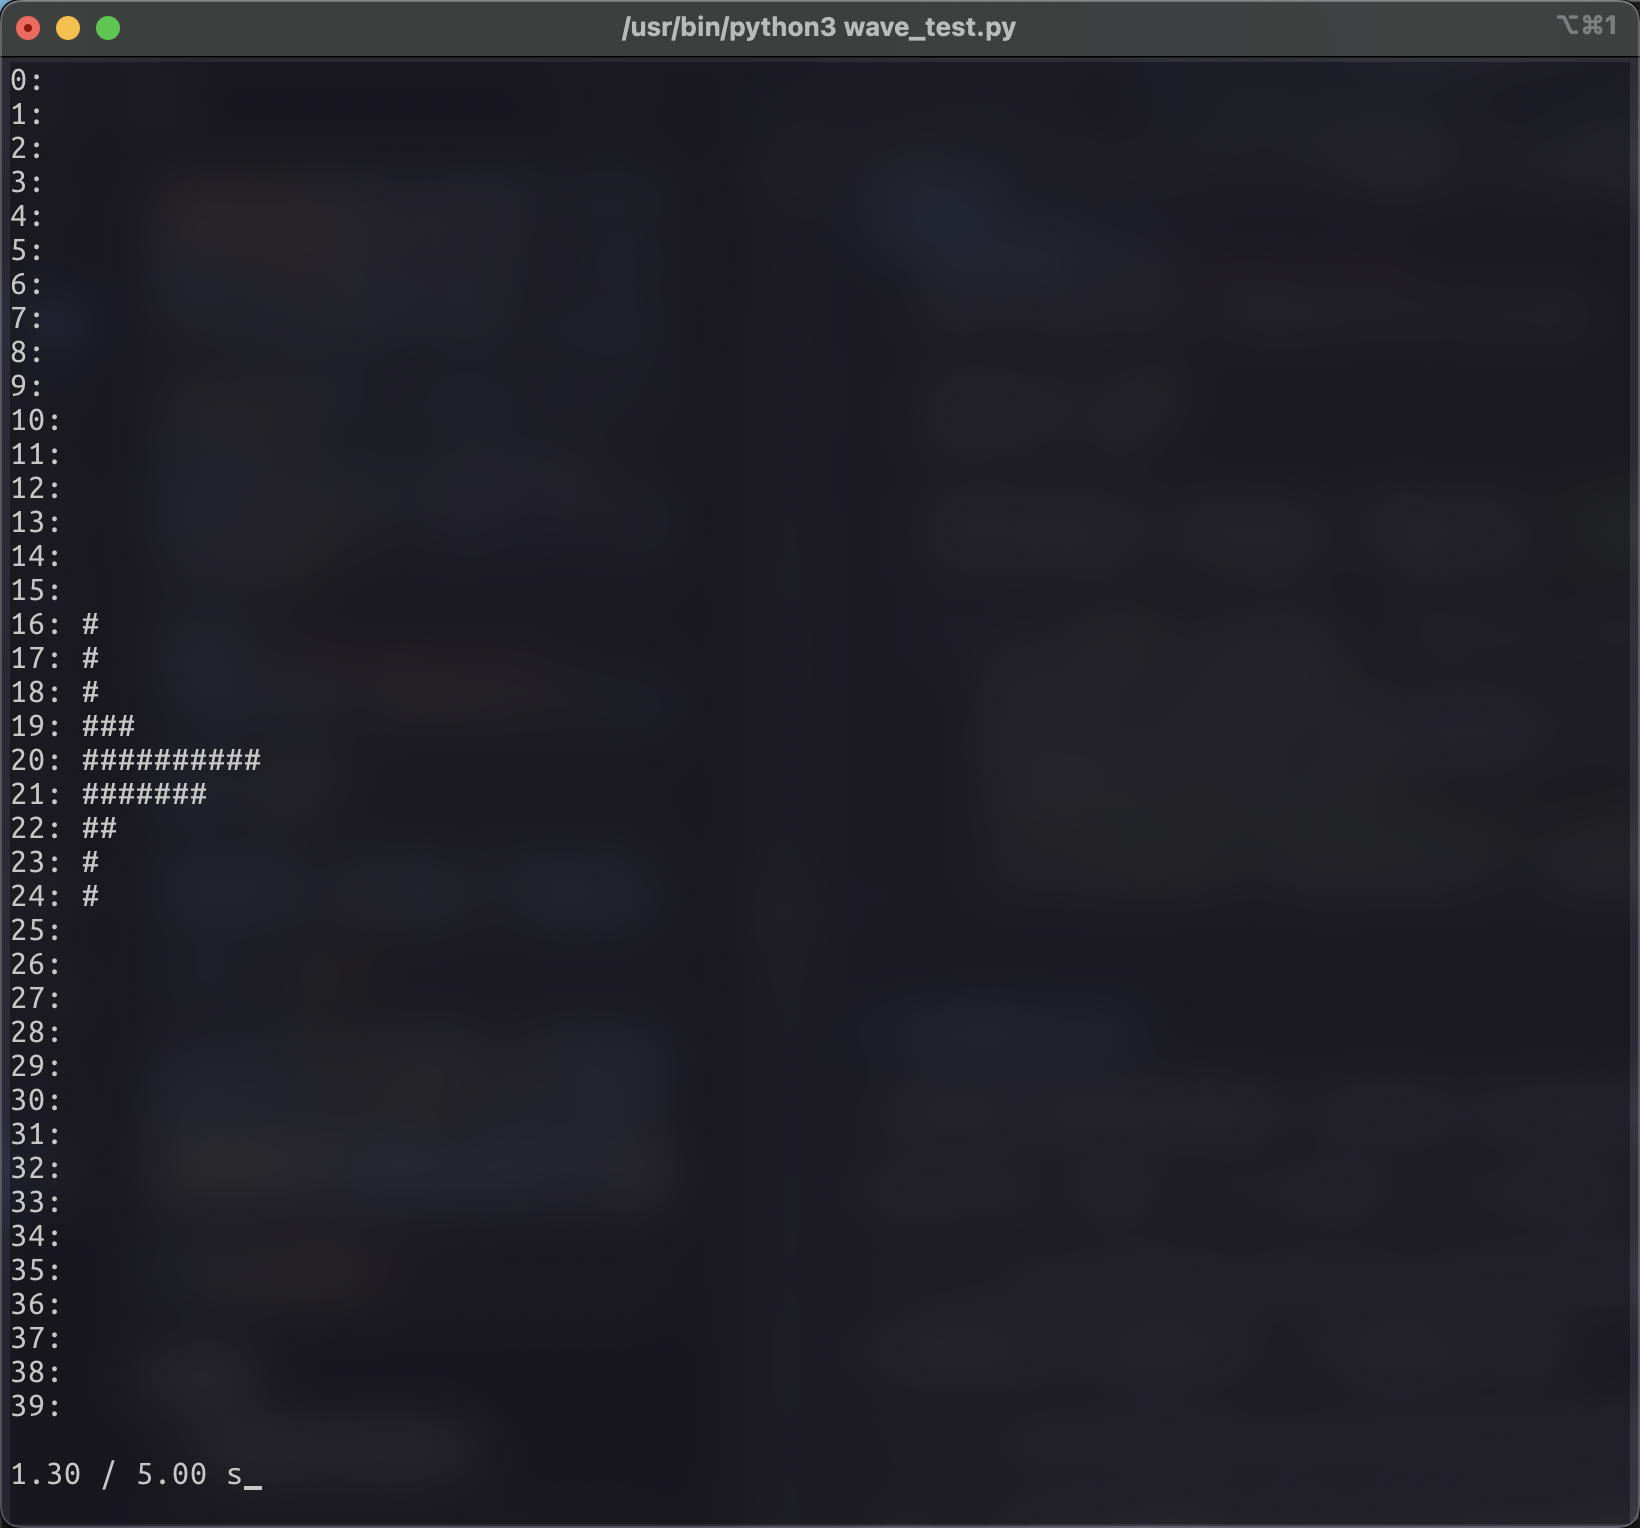
现在还有一个小问题,就是这个频谱图的播放时间(约 8s) 远远高于了实际音乐的播放时间 5s。这是由于我们在每次渲染时,将睡眠时间固定为了 0.05s。没有考虑实际音乐的播放速度和一次循环所用到的采样帧占总采样帧的比例。并且,计算 FFT 和渲染频谱图也是会消耗时间的。
这也很好解决,为了使可视化跟上音乐的播放速度,我们需要知道音乐的总长度、每一个可视化帧应该的播放时间、可视化帧运算和渲染花费的时间,然后动态调整睡眠时间:
1
2
3
4
5
6
7
8
9
10
11
12
13
14
15
16
17
def main (stdscr ): file_name = '440hz_16bit_5s.wav' data, frame_rate = read_wav_file(file_name) frame_size = 2048 hop_size = 1024 frame_duration = hop_size / frame_rate total_duration = len (data) / frame_rate for i in range (0 , len (data) - frame_size, hop_size): start_time = time.time() spectrum = scale_spectrum(fft(data[i:i + frame_size])) draw_spectrum(stdscr, spectrum[:40 ], i / frame_rate, total_duration) elapsed_time = time.time() time.sleep(max (0 , frame_duration - (elapsed_time - start_time)))
接下来,我们来优化这个播放器。比如:不同振幅采用不同的颜色、把频谱图横过来、平滑可视化帧之间的振幅。让我们来进行优化
按照缩放振幅最大值的 0.2、0.4、0.6 倍分割成 4 段,分别采用淡蓝、白、绿、黄颜色区分。
初始化 curses 的颜色对:
1
2
3
4
5
6
7
8
9
10
11
12
13
14
15
16
def init_colors (): global colors curses.start_color() curses.init_pair(1 , curses.COLOR_CYAN, 1 ) curses.init_pair(2 , curses.COLOR_WHITE, 1 ) curses.init_pair(3 , curses.COLOR_GREEN, 1 ) curses.init_pair(4 , curses.COLOR_YELLOW, 1 ) for i in range (MAX_VALUE+1 ): if i / MAX_VALUE <= 0.2 : colors.append(1 ) elif i / MAX_VALUE <= 0.4 : colors.append(2 ) elif i / MAX_VALUE <= 0.6 : colors.append(3 ) else : colors.append(4 )
渲染:
1
2
3
4
5
6
7
8
9
10
11
12
13
14
15
def draw_spectrum (stdscr, spectrum, curr, total ): global colors stdscr.clear() max_y, max_x = stdscr.getmaxyx() spectrum = spectrum[:max_x] half_y = max_y // 2 for i, freq in enumerate (spectrum): for j in range (freq): stdscr.addstr(half_y - j, i, "█" , curses.color_pair(colors[j])) stdscr.addstr(half_y + j, i, "█" , curses.color_pair(colors[j])) stdscr.addstr(max_y - 1 , 0 , f'{curr:.2 f} / {total:.2 f} s' , curses.color_pair(0 )) stdscr.refresh()
然后,我们采用 EMA(移动指数平均)来实现平滑数据。
EMA 的计算公式为:
E M A ( t ) = ( 1 − α ) ⋅ E M A ( t − 1 ) + α ⋅ x ( t ) EMA(t) = (1 - \alpha) \cdot EMA(t-1) + \alpha \cdot x(t)
E M A ( t ) = ( 1 − α ) ⋅ E M A ( t − 1 ) + α ⋅ x ( t )
其中 α \alpha α x ( t ) x(t) x ( t ) E M A ( t − 1 ) EMA(t-1) E M A ( t − 1 )
我们只需要记录上一次的平滑后的频谱值,然后在每一帧的频谱值上应用 EMA 即可。
1
2
3
4
5
6
7
8
9
10
11
12
13
14
15
16
17
18
19
20
21
22
23
24
25
26
27
28
29
30
31
32
def main (stdscr ): init_colors() file_name = 'haruhikage.wav' data, frame_rate = read_wav_file(file_name) frame_size = 4096 hop_size = 2048 frame_duration = hop_size / frame_rate total_duration = len (data) / frame_rate audio_thread = threading.Thread(target=play_audio, args=(file_name,)) audio_thread.start() previous_spectrum = None ema_alpha = 0.5 for i in range (0 , len (data) - frame_size, hop_size): start_time = time.time() spectrum = scale_spectrum(fft(data[i:i + frame_size])) if previous_spectrum is not None : spectrum = [int ((1 - ema_alpha) * prev + ema_alpha * curr) for prev, curr in zip (previous_spectrum, spectrum)] draw_spectrum(stdscr, spectrum, i / frame_rate, total_duration) previous_spectrum = spectrum elapsed_time = time.time() time.sleep(max (0 , frame_duration - (elapsed_time - start_time))) audio_thread.join()
挺像回事了hhh。最后,我们再对整个代码进行一轮优化。
第零,既然这是一个可以可视化音频的工具,为什么不能同时播放音乐呢?于是我用了 simpleaudio 模块,在子线程中同步播放音乐。
第一,上面的代码没有考虑窗口自适应,我们需要在每一次循环中都取一次窗口大小 max_x 和 max_y,当窗口发生变化时重新计算 colors 列表。
第二,现在的计算方式是一次性将 4096 个采样帧都进行 EMA 计算,实际我们只需要将窗口的 max_x 个采样帧进行 EMA 计算和存储即可。
第三,我通过和实际音乐播放的时间比对发现,整个渲染部分还是会有延迟(基本上每秒会有 0.003 秒的延迟),如果任由其累加,到了后面,实际的音频播放会和可视化频谱有很大的错位。我直接计算了实际播放时间和可视化帧时间的差,将其作为 delay,然后在 time.sleep() 时直接减去这个 delay,这样就能在单次帧渲染时把 delay 给消除。
第四,测试发现很多振幅低的频率在频谱图中几乎不可见,这是因为我们采用的是线性归一化,高振幅的频率会压缩低振幅的频率。我们可以换成平方根归一化,这样可以减少高低频率振幅的差距。
第五,我发现渲染帧率太高了,而帧之间的振幅变化又太快,导致频谱图看起来很闪烁。于是我设置了一个固定的帧率 fps 和频谱数据缓冲区,其大小为 frame_duration / (1/fps),频谱数据先放入缓冲区,当缓冲区满时全部取出,并求平均值,然后再进行 EMA 计算和渲染。
后续发现其实调大 hop_size 就行。想复杂了 = =
优化后的完整代码如下:
1
2
3
4
5
6
7
8
9
10
11
12
13
14
15
16
17
18
19
20
21
22
23
24
25
26
27
28
29
30
31
32
33
34
35
36
37
38
39
40
41
42
43
44
45
46
47
48
49
50
51
52
53
54
55
56
57
58
59
60
61
62
63
64
65
66
67
68
69
70
71
72
73
74
75
76
77
78
79
80
81
82
83
84
85
86
87
88
89
90
91
92
93
94
95
96
97
98
99
100
101
102
103
104
105
106
107
108
109
110
111
112
113
114
115
116
117
118
119
120
121
122
123
124
125
126
127
128
129
130
131
132
133
134
135
136
137
138
139
140
141
142
143
144
145
146
147
148
149
150
151
152
153
154
import waveimport structimport mathimport cmathimport cursesimport timeimport threadingimport simpleaudio as sadef read_wav_file (file_name ): with wave.open (file_name, 'rb' ) as wf: num_channels = wf.getnchannels() sample_width = wf.getsampwidth() frame_rate = wf.getframerate() num_frames = wf.getnframes() raw_data = wf.readframes(num_frames) total_samples = num_frames * num_channels fmt = f"<{total_samples} h" data = struct.unpack(fmt, raw_data) data = [data[i] for i in range (0 , len (data), num_channels)] return data, frame_rate def fft (x ): N = len (x) if N <= 1 : return x even = fft(x[0 ::2 ]) odd = fft(x[1 ::2 ]) T = [cmath.exp(-2j * math.pi * k / N) * odd[k] for k in range (N // 2 )] return [even[k] + T[k] for k in range (N // 2 )] + \ [even[k] - T[k] for k in range (N // 2 )] def scale_spectrum (spectrum_complex, max_y ): '''将频谱复数转换为振幅,并归一化''' max_y = int ((max_y // 2 ) * 0.8 ) spectrum = [abs (freq) for freq in spectrum_complex] max_spectrum = max (max (spectrum), 1 ) return [int (max_y * math.sqrt(freq) / math.sqrt(max_spectrum)) for freq in spectrum] def draw_spectrum (stdscr, spectrum: list [int ], max_y: int ): global colors stdscr.clear() half_y = max_y // 2 for i, freq in enumerate (spectrum): for j in range (freq): stdscr.addstr(half_y - j, i, "█" , curses.color_pair(colors[j])) stdscr.addstr(half_y + j, i, "█" , curses.color_pair(colors[j])) def play_audio (file_name ): wave_obj = sa.WaveObject.from_wave_file(file_name) play_obj = wave_obj.play() play_obj.wait_done() def init_colors (): curses.start_color() curses.init_pair(1 , curses.COLOR_CYAN, 1 ) curses.init_pair(2 , curses.COLOR_WHITE, 1 ) curses.init_pair(3 , curses.COLOR_GREEN, 1 ) curses.init_pair(4 , curses.COLOR_YELLOW, 1 ) def adjust_colors (max_y ): global colors max_y = max_y // 2 for i in range (max_y+1 ): if i / max_y <= 0.2 : colors.append(1 ) elif i / max_y <= 0.4 : colors.append(2 ) elif i / max_y <= 0.6 : colors.append(3 ) else : colors.append(4 ) def ema (alpha, prev, curr ): new = [] for i in range (len (curr)): if i >= len (prev): new.append(int (curr[i])) else : new.append(int ((1 - alpha) * prev[i] + alpha * curr[i])) return new def main (stdscr ): init_colors() file_name = 'haruhikage.wav' frame_size = 2048 hop_size = 1024 ema_alpha = 0.4 fps = 40 data, frame_rate = read_wav_file(file_name) frame_duration = hop_size / frame_rate total_duration = len (data) / frame_rate audio_thread = threading.Thread(target=play_audio, args=(file_name,)) audio_thread.start() play_start_time = time.time() previous_spectrum = None last_max_y, _ = stdscr.getmaxyx() adjust_colors(last_max_y) cached_list = [] ideal_frame_time = 1 / fps cached_size = max (ideal_frame_time // frame_duration, 1 ) for i in range (0 , len (data) - frame_size, hop_size): start_time = time.time() max_y, max_x = stdscr.getmaxyx() if max_y != last_max_y: adjust_colors(max_y) last_max_y = max_y spectrum = scale_spectrum(fft(data[i:i + frame_size])[:max_x], max_y) if len (cached_list) >= cached_size: spectrum = [sum (x) // len (x) for x in zip (*cached_list)] cached_list = [] if previous_spectrum is not None : spectrum = ema(ema_alpha, previous_spectrum, spectrum) draw_spectrum(stdscr, spectrum, max_y) previous_spectrum = spectrum else : cached_list.append(spectrum) elapsed_time = time.time() _render_time = elapsed_time - start_time _frame_time = i / frame_rate _actual_frame_time = elapsed_time - play_start_time _delay = _actual_frame_time - _frame_time stdscr.addstr(max_y - 1 , 0 , f'({_actual_frame_time:.2 f} s) {_frame_time:.2 f} / {total_duration:.2 f} s delay: {(_delay):.5 f} s render: {_render_time:.5 f} s frame: {frame_duration:.5 f} s' , curses.color_pair(0 )) stdscr.refresh() time.sleep(max (0 , frame_duration - _render_time - _delay)) audio_thread.join() if __name__ == "__main__" : colors = [] curses.wrapper(main)
我们用它来播放一下来自 CHYCHIC 的 haruhikage.wav:
(该demo不是最终版本!下面还有两个优化!!)
相比于 ncmpcpp 的效果,还有很多地方需要优化,比如多声道支持、更平滑的频谱图。
(下面是 Update,已经更新了多声道支持)
查阅了相关资料,突然发现我们可以设置两个 EMA Alpha,一个是当 prev_spectrum 小于 curr_spectrum 时的 alpha1,一个是当 prev_spectrum 大于 curr_spectrum 时的 alpha2。前者可以让频谱图更快地上升,后者可以让频谱图更慢地下降。这样就可以让频谱图更加丝滑了。
主函数:
1
2
3
4
5
6
7
8
9
10
11
def main (stdscr ): init_colors() file_name = args.parse_args().file frame_size = 2048 hop_size = 1600 ema_alpha_down = 0.93 ema_alpha_up = 0.2
EMA 函数:
1
2
3
4
5
6
7
8
9
10
11
12
13
def ema (alpha_down: float , alpha_up: float , prev: list , curr: list ): '''Exponential Moving Average''' new = [] for i in range (len (curr)): if i >= len (prev): new.append(int (curr[i])) else : if prev[i] > curr[i]: new.append(int (alpha_down * prev[i] + (1 - alpha_down) * curr[i])) else : new.append(int (alpha_up * prev[i] + (1 - alpha_up) * curr[i])) return new
效果如下:
可以发现,在鼓点来时,频谱图上升得很快,而在鼓点过后,频谱图下降得很慢。这样就显得更加丝滑!
在前面的实现中,我们默认绘图的字符是 “█”,然而,它在 unicode 中叫作 “Full block”。它还有 7 个兄弟:
1 blocks = ['▁' , '▂' , '▃' , '▄' , '▅' , '▆' , '▇' , '█' ]
我们可以借此实现更加丝滑的频谱图。
首先,scale 的最大值可以直接乘以 len(blocks):
1 last_scale_max_val = int ((max_y * len (blocks) // 2 ) * 0.8 )
然后我们的振幅范围就在 [0, last_scale_max_val] 之间。
在绘图时,前 val // len(blocks) 个字符使用 Full Block,最后一个字符使用 blocks[val % len(blocks)]。
我们稍加修改 draw_spectrum 函数:
1
2
3
4
5
6
7
8
9
10
11
12
13
14
15
16
17
18
19
20
21
22
23
24
25
26
27
28
def draw_spectrum (stdscr, spectrum: list [list [int ]], max_y: int ): global colors stdscr.clear() half_y = max_y // 2 for i, freq in enumerate (spectrum[0 ]): full_1 = min (freq // len (blocks), len (colors)) full_2 = min (spectrum[1 ][i] // len (blocks), len (colors)) left_1 = freq % len (blocks) left_2 = spectrum[1 ][i] % len (blocks) for j in range (full_1): stdscr.addstr(half_y - j, i, blocks[-1 ], curses.color_pair(colors[j])) if len (spectrum) == 1 : stdscr.addstr(half_y + j, i, blocks[-1 ], curses.color_pair(colors[j])) continue for j in range (full_2): stdscr.addstr(half_y + j, i, blocks[-1 ], curses.color_pair(colors[j])) if left_1 > 0 : stdscr.addstr(half_y - full_1, i, blocks[left_1], curses.color_pair(colors[full_1-1 ])) if len (spectrum) == 1 : stdscr.addstr(half_y + full_1, i, blocks[left_1], curses.color_pair(colors[full_1-1 ])) if left_2 > 0 : stdscr.addstr(half_y + full_2, i, blocks[left_2], curses.color_pair(colors[full_2-1 ]))
OHHH! 看样子更加丝滑了!… 怎么下面的频谱图变得断断续续了?
因为我们的 blocks 使用的 unicode 字符的填充是从下往上的,因此就会导致在绘制下半部分频谱图时,末端使用的字符方向不对,导致 full block 和其他 block 之间有间隙。怎么解决呢?似乎 unicode 字符没有从上往下填充的字符。
一个好办法是创造一个 colors_reverse,其颜色配置和 colors 相反,比如 colors 中一个 color 的前景是淡蓝色,背景是黑色,那么 colors_reverse 中这个 color 的前景就是黑色,背景就是淡蓝色。然后我们在绘制频谱图时,将下半部分的频谱图字符颜色设置为 colors_reverse 中的某个。
1
2
3
4
5
6
7
8
9
10
11
12
def draw_spectrum (stdscr, spectrum: list [list [int ]], max_y: int ): for i, freq in enumerate (spectrum[0 ]): if left_1 > 0 : stdscr.addstr(half_y - full_1, i, blocks[left_1], curses.color_pair(colors[full_1-1 ])) if len (spectrum) == 1 : stdscr.addstr(half_y + full_1, i, blocks[left_1], curses.color_pair(colors_reverse[full_1-1 ])) if left_2 > 0 : stdscr.addstr(half_y + full_2, i, blocks[left_2], curses.color_pair(colors_reverse[full_2-1 ]))
效果如下:
快赶上 ncmpcpp 的效果了!
后面有时间再继续优化喵。
上文讲到傅立叶变换的基本思想是将一个信号分解为一系列正弦波的叠加。
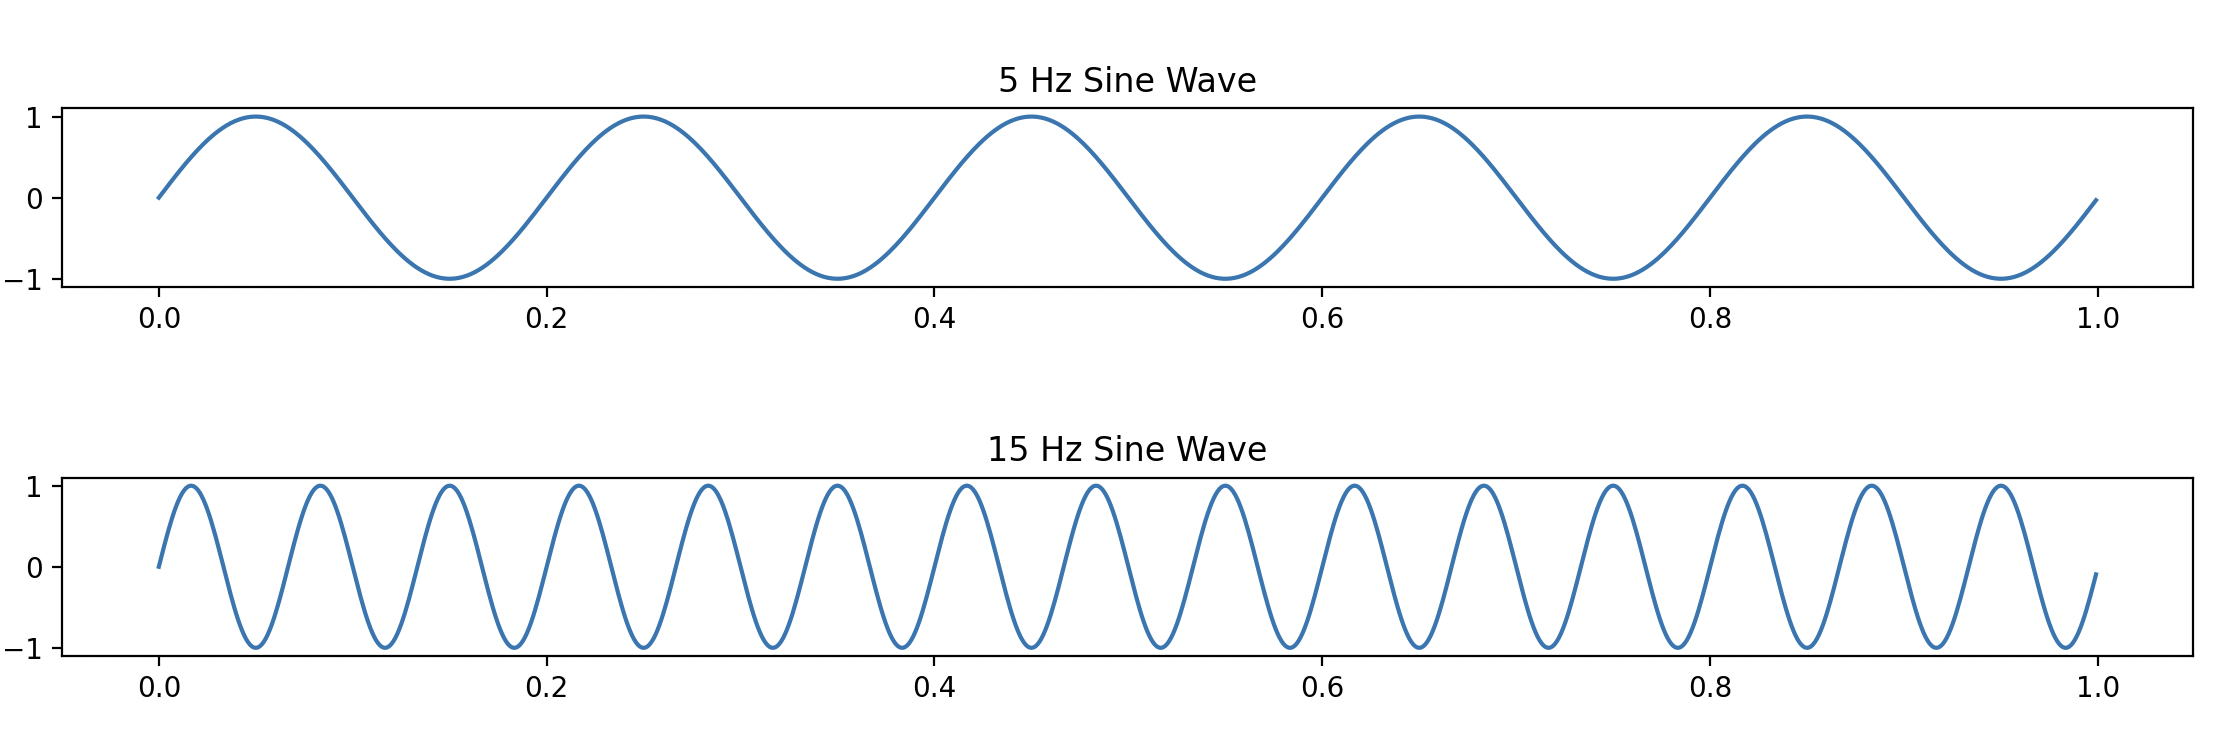
拿方波举个例子,下图是一个 5Hz 的方波和一个 5Hz 的正弦波
是不是差距蛮大的?那如果我们将 2 个正弦波叠加在一起呢?
我们会发现,更像方波了。随着我们叠加的正弦波越来越多,我们的波形就会越来越接近方波。
我们日常听的音乐就是由大量不同频率的正弦波叠加而成的,而傅立叶变换就能够将其分解为一系列不同频率的波。
为了直观理解傅立叶变换,我参考了 @3b1b 的视频 里的方法。
还是以 5Hz 的正弦波为例。
440hz_16bit_5s.wav:
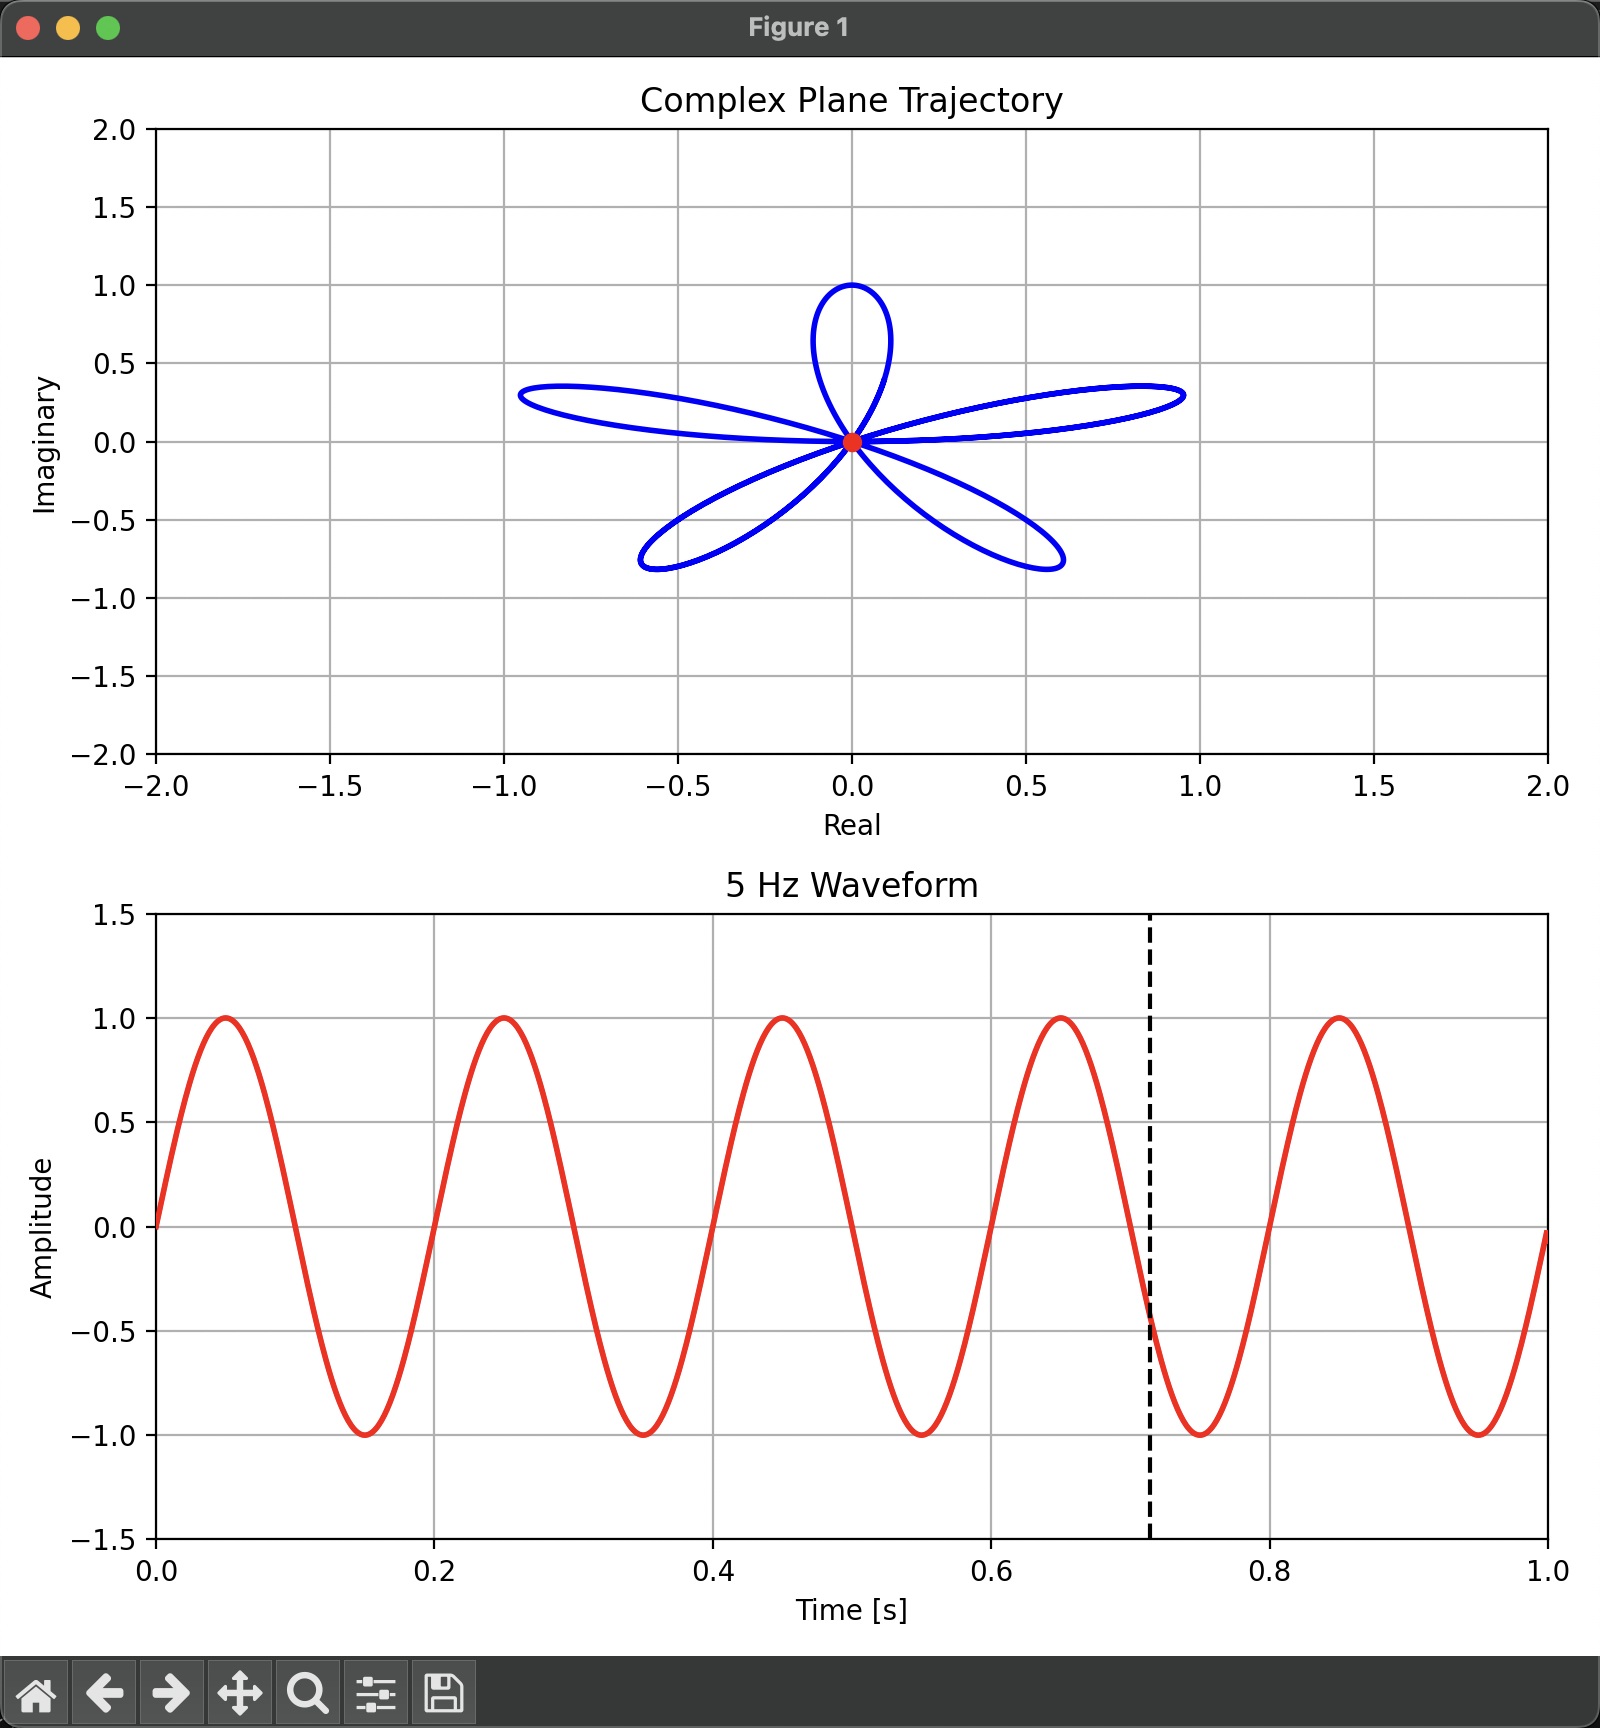
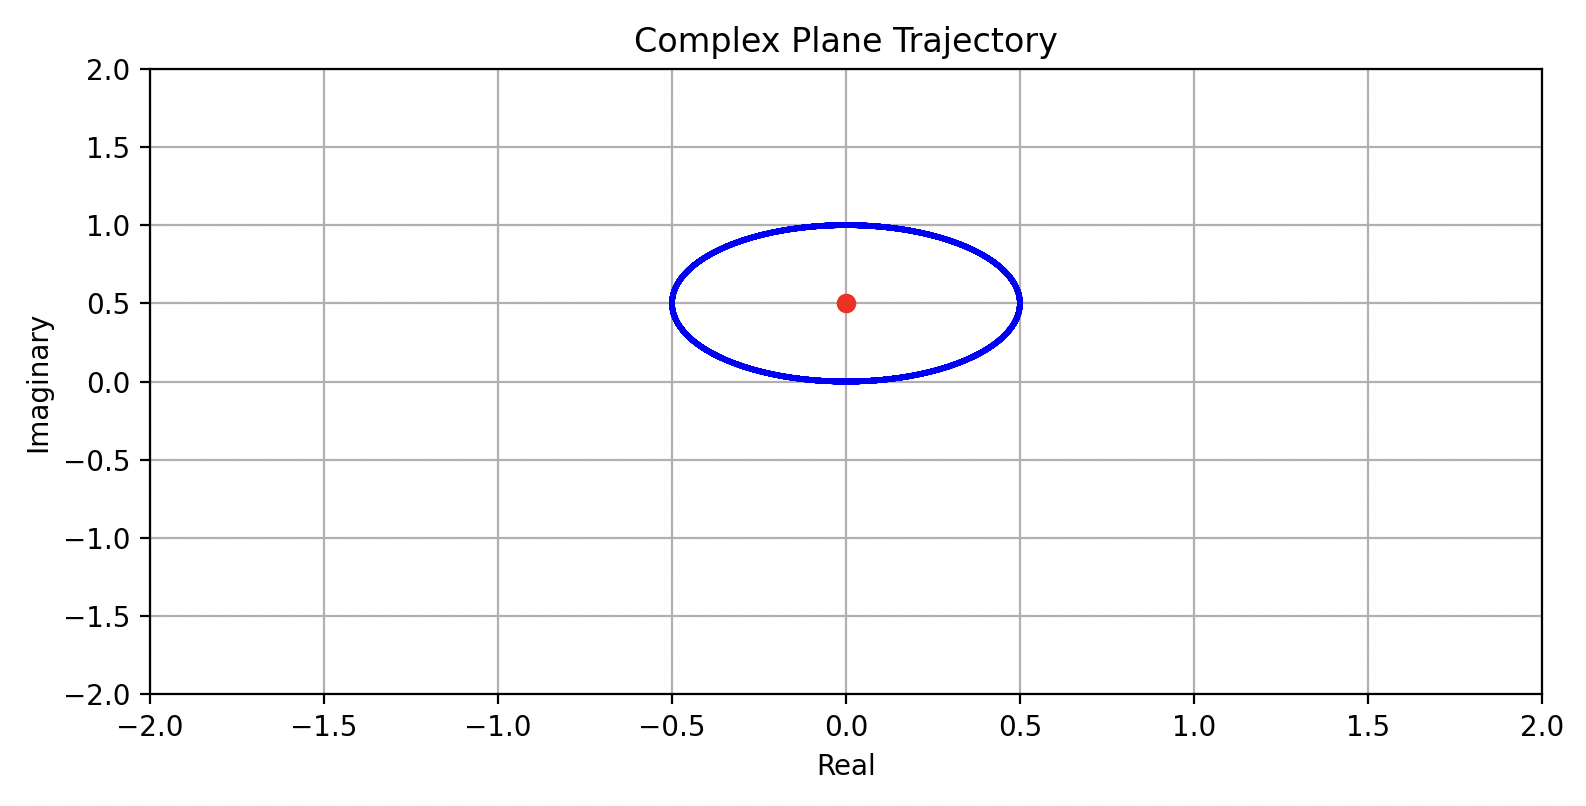
我们在复平面上从实数轴正半轴开始逆时针转动一个向量:在任意时刻下,向量的模长等于正弦波的振幅,向量的移动速度设置为 1 Hz,以此绘制得到一个图:
它的质心用红点标了出来。
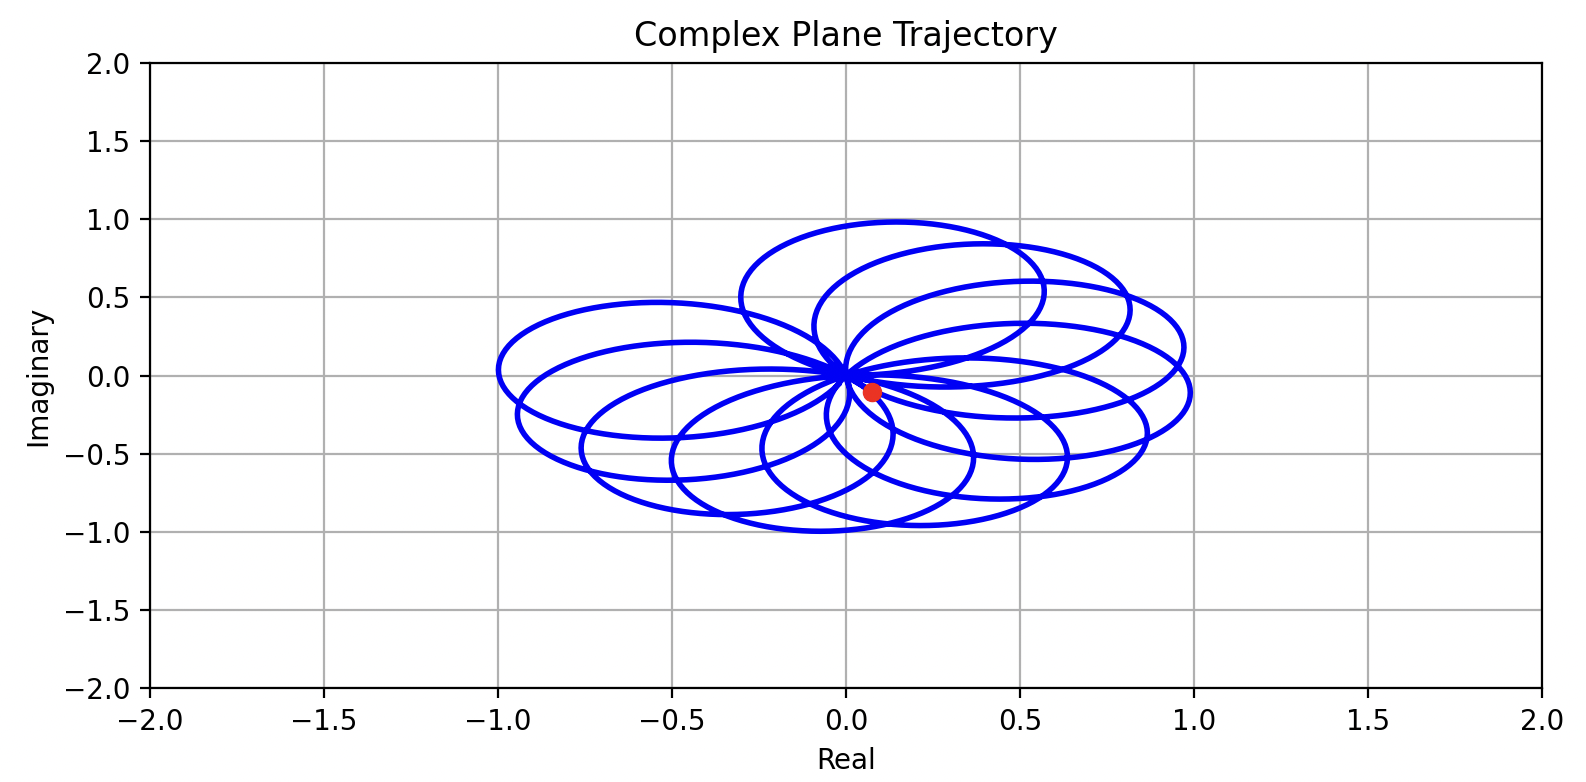
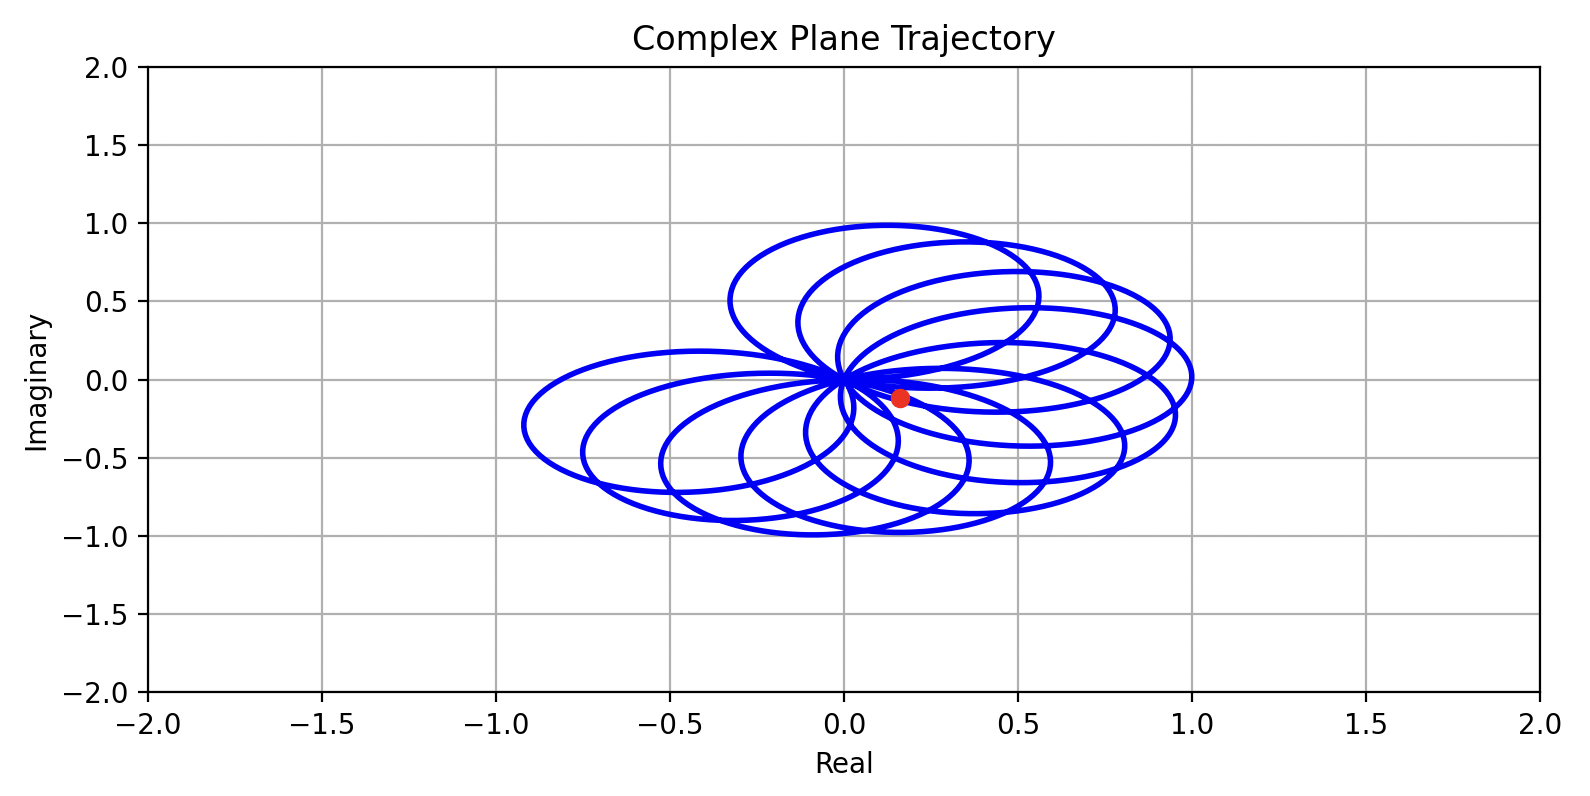
当向量的移动速度设置为 4.2 Hz 时:
当向量的移动速度设置为 4.3 Hz 时:
当向量的移动速度设置为 5 Hz 时:
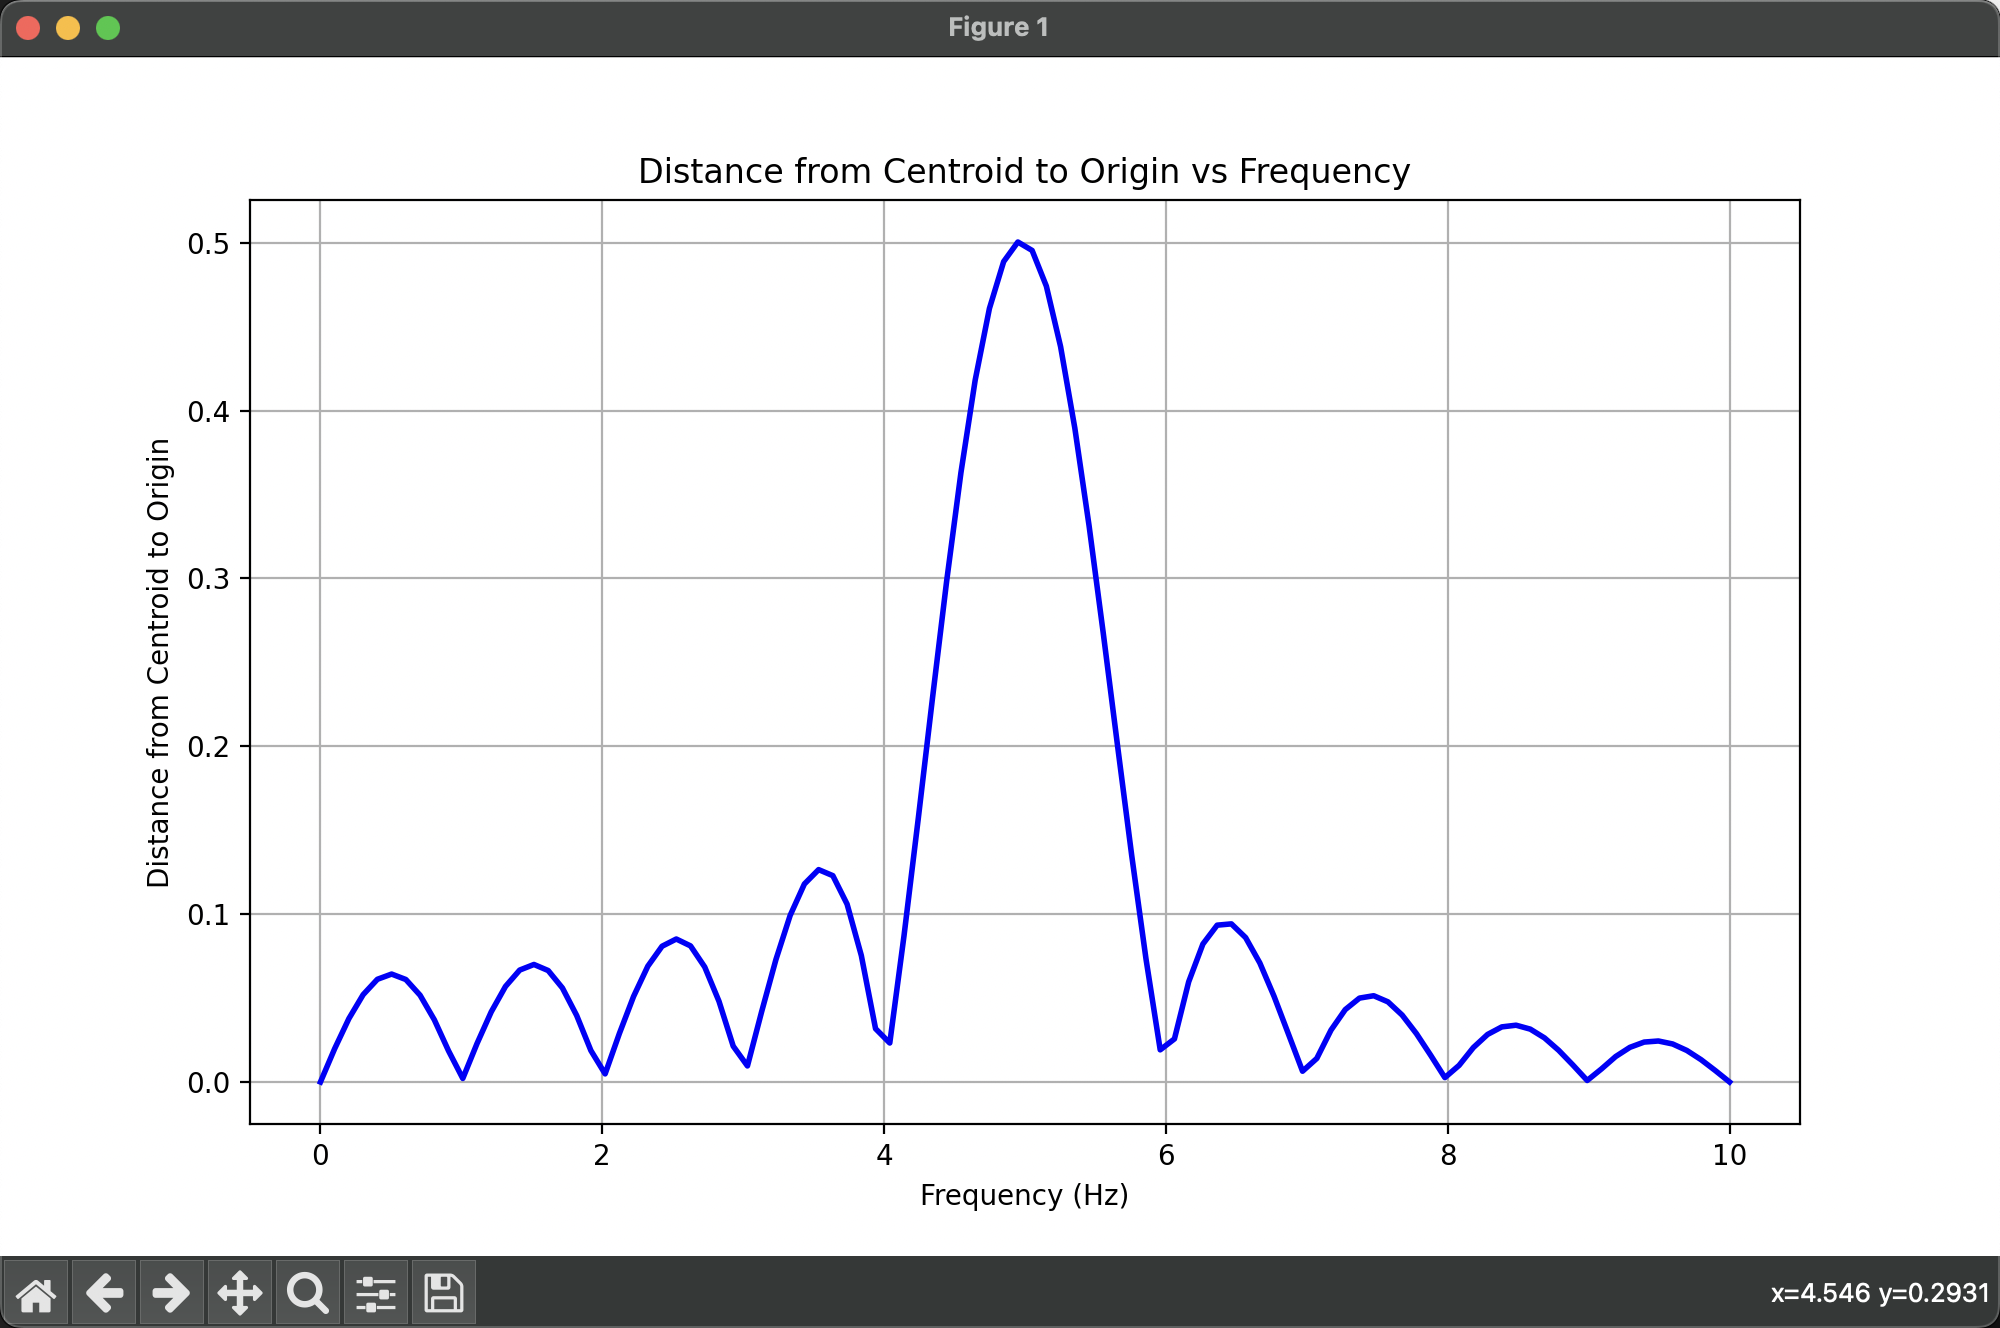
有没有发现什么?我们绘制出质心与原点的距离随向量的移动速度变化的图(我们称为“缠绕图像”):
在接近 5 Hz 时,值最大!!
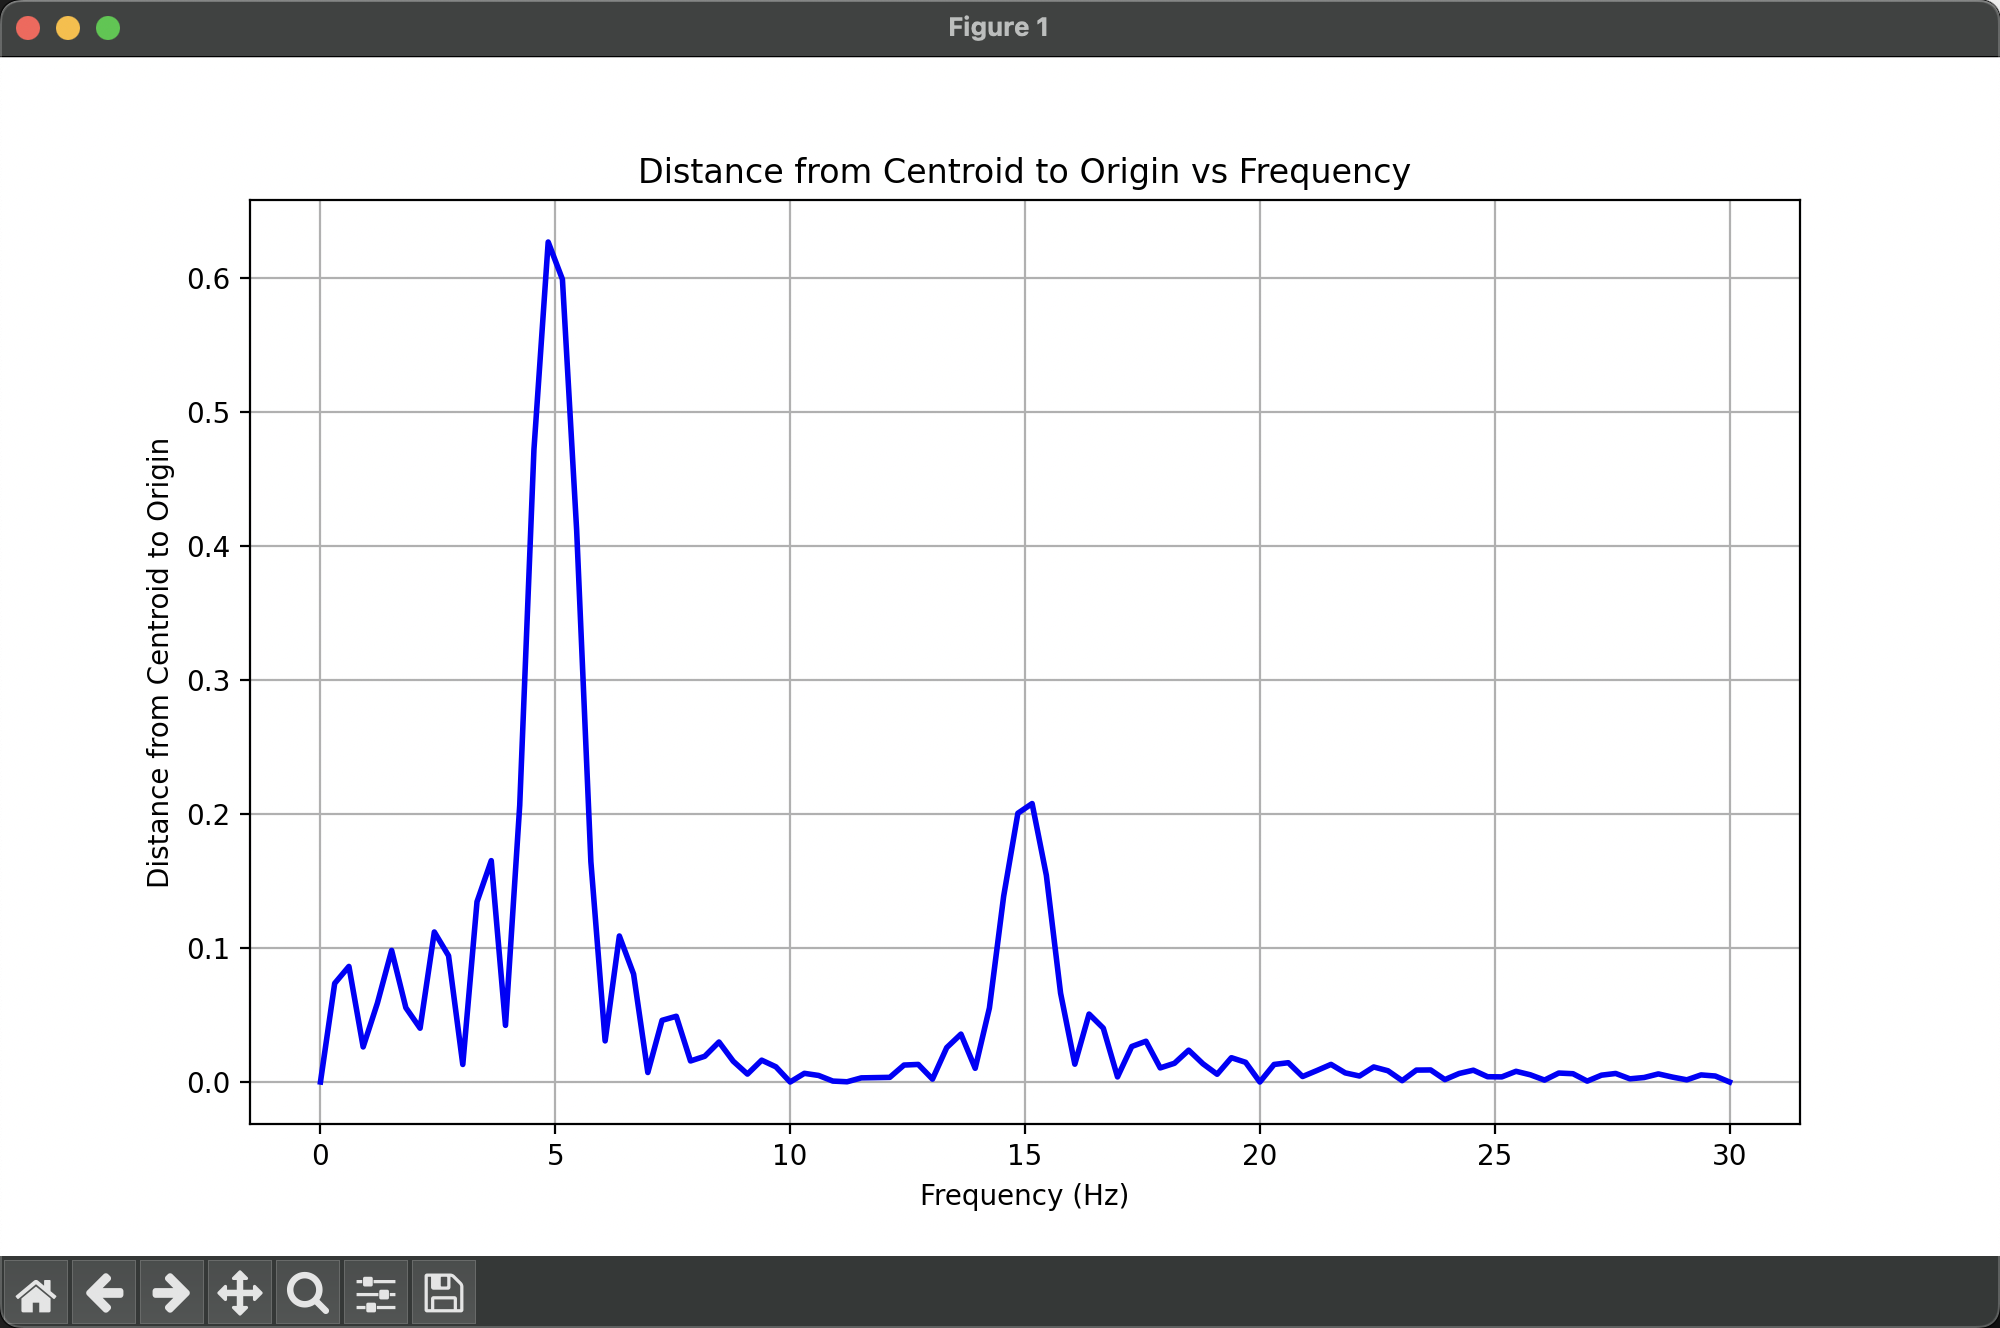
同样,我们将 5Hz + 15Hz 的正弦波叠加在一起,再次绘制这个图:
极大值点同样出现在 5Hz 和 15Hz 处。
发生了什么?让我们从公式的角度出发,来解释这个现象。
由欧拉公式,我们知道,一个圆周运动可以表示为:
e 2 π i f t e^{2\pi i f t}
e 2 π i f t
其中 f f f t t t
上述像花一样的缠绕图像可以表示为:
g ( t ) e 2 π i t g(t) e^{2\pi i t}
g ( t ) e 2 π i t
其中,g(t) 为正弦函数:$ g(t) = \sin(2\pi 5 t) $,也就是一个振幅随时间变化的方程。
我们需要描述的是其质心在复平面上的坐标的模随时间变化的方程。因此随机取 N N N
1 N ∑ n = 1 N ∣ g ( t n ) e 2 π i t n ∣ \frac{1}{N} \sum_{n=1}^{N} |g(t_n) e^{2\pi i t_n}|
N 1 n = 1 ∑ N ∣ g ( t n ) e 2 π i t n ∣
类似这样,我们对函数作积分,就得到了傅立叶变换:
∫ t 1 t 2 ∣ g ( t ) e 2 π i t ∣ d t \int_{t_1}^{t_2} |g(t) e^{2\pi i t}| dt
∫ t 1 t 2 ∣ g ( t ) e 2 π i t ∣ d t
其值表示的是在 t 1 t_1 t 1 t 2 t_2 t 2 f f f
看文字不如直接看 @3b1b 的视频 。
本文介绍了 wav 的编码结构和傅立叶变换在音频可视化中的应用,并手搓了一个 TUI 的支持频谱可视化的音频播放器。最后,我们通过直观的方式理解了傅立叶变换的基本原理。
代码开源在了 GitHub ,可以去玩玩。
[1] WAVE File Format. https://web.archive.org/web/20140221054954/http://home.roadrunner.com/~jgglatt/tech/wave.htm
[2] But what is the Fourier Transform? A visual introduction. https://www.youtube.com/watch?v=spUNpyF58BY
[3] 为什么要进行傅立叶变换. https://ibillxia.github.io/blog/2013/04/04/why-do-Fourier-transformation/
